on
Visualising League Arena Mode Finishes Using Python and Web Scraping
The League Arena mode is an exciting, temporary game mode in League of Legends where players can finish anywhere between 1st and 8th place. This script leverages data from op.gg to scrape the finishing positions and then visualises this data, providing insights such as top 4 finishes, wins, and win percentages.
What the Script Does
This Python script is designed to help players analyse their performance in League Arena mode. By scraping data from op.gg, it collects all your finishing positions from 1st to 8th place and then visualises this data to provide a clear understanding of your overall performance.
Data Collection
The script first scrapes op.gg to gather data on your match results. Using libraries like BeautifulSoup and requests, it extracts the finishing positions from your game history. Here’s a snippet of the scraping process:
import requests
from bs4 import BeautifulSoup

url = 'https://op.gg/summoner/userName=YourSummonerName'
response = requests.get(url)
soup = BeautifulSoup(response.text, 'html.parser')

# Example of scraping the finishes
finishes = [int(tag.text) for tag in soup.find_all(class_='placement')]
Data Processing
Once the data is scraped, it is processed into a dictionary, where the keys represent the finishing positions (1st to 8th), and the values represent how many times each position was achieved.
rank_counts = {1: 10, 2: 7, 3: 12, 4: 9, 5: 8, 6: 5, 7: 3, 8: 2}
Visualisation
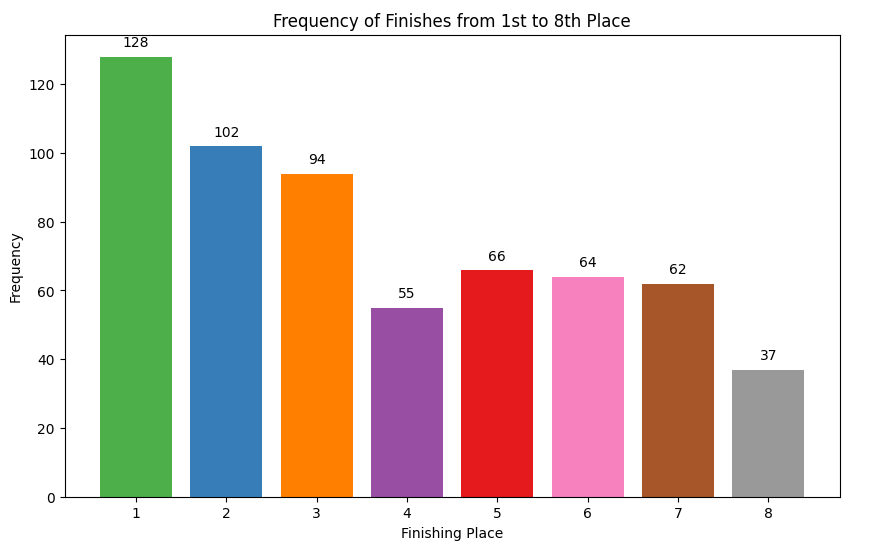
Next, the script creates a bar chart to visualise the frequency of each finishing position. This helps you quickly see how many times you placed in the top 4, how many wins you have, and your overall win percentage.
import matplotlib.pyplot as plt

places = list(rank_counts.keys())
frequencies = list(rank_counts.values())

# Create the bar chart
plt.figure(figsize=(10, 6))
bars = plt.bar(places, frequencies, color=['#4daf4a', '#377eb8', '#ff7f00', '#984ea3', '#e41a1c', '#f781bf', '#a65628', '#999999'])

# Add text on the bars
for bar, freq in zip(bars, frequencies):
    yval = bar.get_height()
    plt.text(bar.get_x() + bar.get_width()/2, yval + 2, freq, ha='center', va='bottom')

plt.xlabel('Finishing Place')
plt.ylabel('Frequency')
plt.title('Frequency of Finishes from 1st to 8th Place')
plt.show()
Insights Provided
- Top 4 Finishes: By analysing the data, you can easily see how often you finished in the top 4, which is usually considered a strong performance.
- Wins and Win Percentage: The script also calculates your total wins and win percentage by dividing the number of 1st place finishes by the total games played.
Here is an example of my statistics after 608 games played:


Conclusion
This script is a powerful tool for analysing your performance in the League Arena mode. By scraping data from op.gg and visualising it, you can gain valuable insights into your strengths and weaknesses. Whether you’re aiming to improve your top 4 finishes or increase your win percentage, this script provides the data you need to track your progress over time.
Feel free to try it out and see how your Arena mode performance stacks up!
Download the Notebook (You will need ChromeDriver for the webscraping)